![]()
Of all of children’s TV, my favorite show is Arthur, the adventures of that beloved, perpetually-eight-years-old aardvark and all of his friends and family that has been on the air since the year I was born, making it the second-longest running animated series in history.
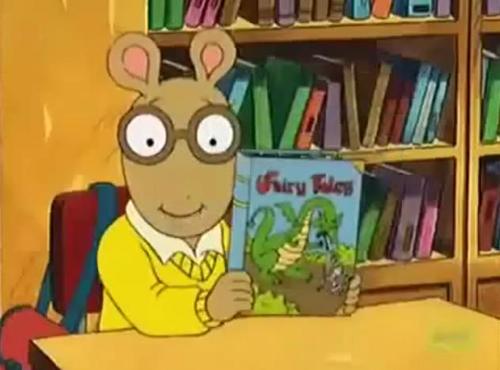
A season 5 episode of Arthur entitled “Just Desserts” (link to watch) (IMDb citation) has always been one of my favorites. After Arthur eats too much candy, he is thrown into an imaginative dream sequence (which most episodes of Arthur contain) that, in only seven minutes, skillfully weaves four different fairy tale plots together: Hansel & Gretel, Snow White, Little Red Riding Hood, and Jack & the Beanstalk.
This process of mashing up fairy tale motifs together in such a short amount of screen time intrigued me enough to research it on a larger scale for presentation at the Western States Folklore Society’s Annual Meeting at UC Berkeley last April (read about my experience at this link)
My first step in completing this project was to go to the database and pull everything I needed. Our Fairy Tales on Television database is huge, containing over 1500 individual data points, and I found each data point that met both parameters of my project:
1) From a children’s TV show
2) Tagged with more than one fairy tale type
And then I, English major and folklore scholar that I am, was met with a set of 31 data points from which to begin to ask questions and draw conclusions about the way that children’s television employs fairy tales in combination with each other. I figured that the best way to find something interesting was to make the data visual, so I embraced digital humanities tactics, made myself a gigantic spreadsheet, and started quantifying and graphing.
I was particularly interested in the first step of the process, where the creators of the television show would choose to use fairy tales. What kind of combinations made the most sense? Which fairy tales lent themselves most easily to combination with other tales? In accordance with this, I focused my research on the tale types in general instead of their specific context within the episodes.
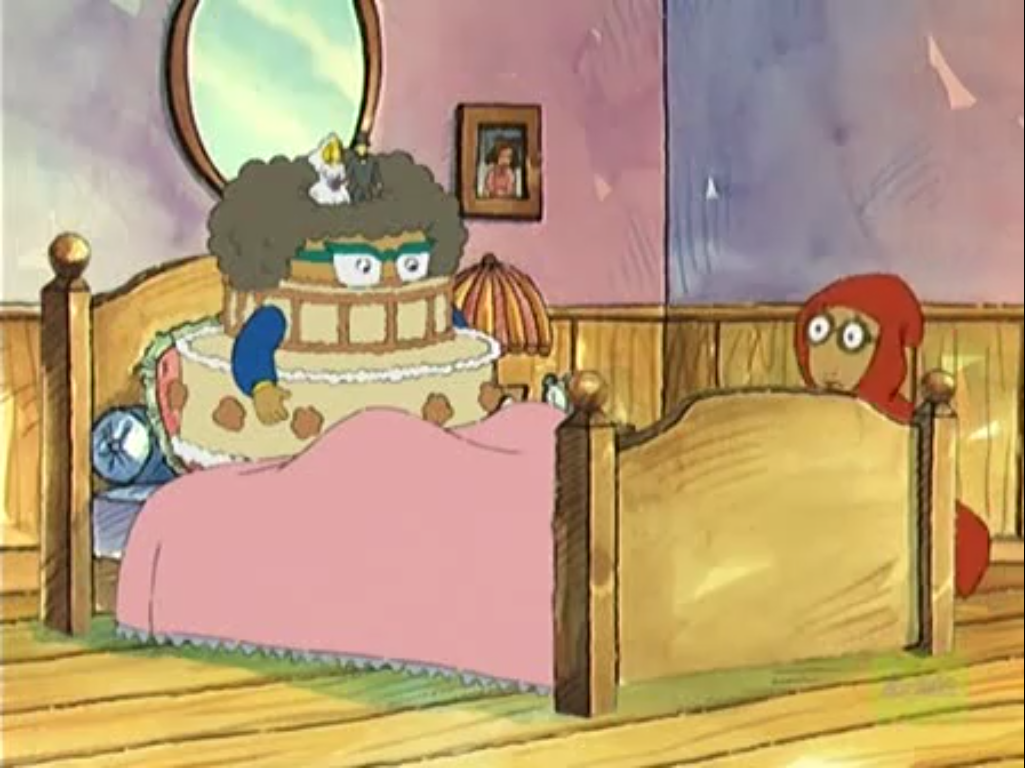
This picture illustrates that, despite Arthur, who is a male character, playing Little Red Riding Hood in this adaptation, the protagonist code for Little Red Riding Hood remains female. In his dreamscape of this episode, he also plays Hansel, Jack, Little Red Riding Hood, and the Big Bad Wolf. In the process of adaptation for TV and for mashups, many of the tales become twisted in a way that could change the tale beyond recognition if it wasn’t for the trusty fairy tale iconography, such as the red cape.
After gathering the data, I proceeded to lump the data points into groups by what tales they used: gender of protagonist, whether the protagonist was a child or an adult, human or animal tale, the nature of the fairy tale world, the character of the villain in the story, the origin of the tale, the year the episode aired, and on and on.
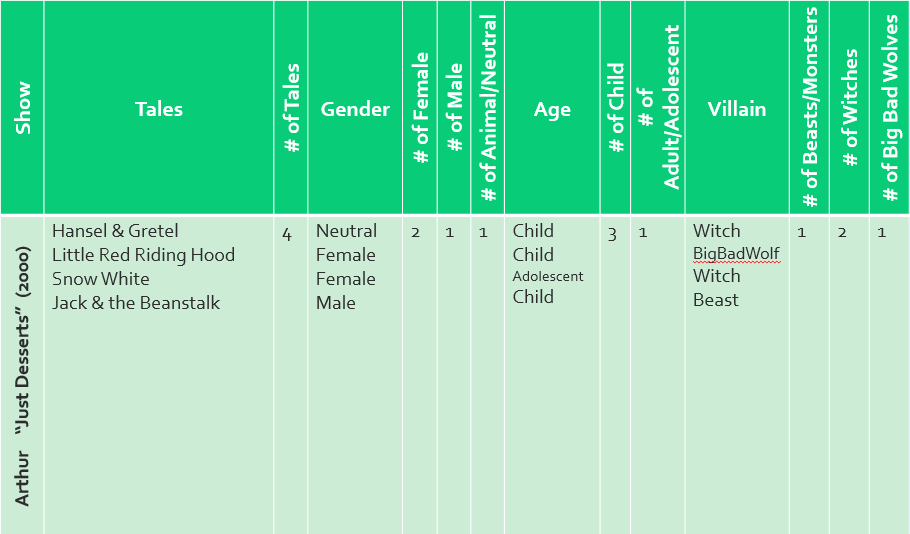
Here is an inside look at my methodology for the example episode. I continued this system of assigning codes to fairy tale types for the other data points in the sets.
This system of converting fairy tale types into numerical data enabled me to create graphs to see trends or interesting patterns. One is the rising number of tales found in each mashup episode.
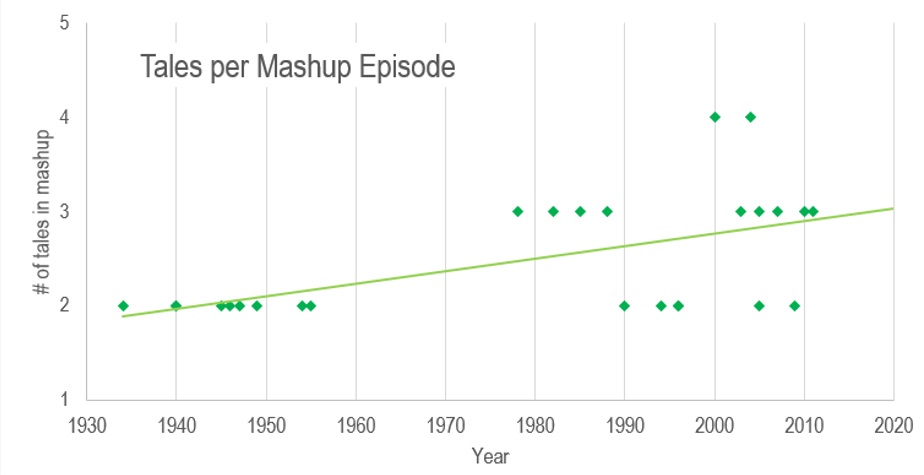
This pattern is an interesting time-dependent pattern. We can see an increase in the number of tales found in each mashup episode. Before a 1978 episode of Super Friends entitled “Fairy Tale of Doom” aired, there were no fairy tale mashup episodes that used more than two tales together. But in the decade between 2000 and 2010, there were more mashups of three or four tales (such as “Just Desserts”) than of only two. Will this pattern increase? Will a show be able to fit five tales together in one episode soon? What about six?
Stay tuned in the coming weeks for my findings concerning gender and age patterns, mashup strategies, and other questions that arose as I worked with this data.
And go watch that Arthur episode! It’s only eleven minutes long and so much fun!
It’s interesting that you should reference Super Friends. If anything, the modern trend of “mashing up” fairy tales or fairy tale characters is drawn from the convention in superhero comics that the Super Friends is drawn from: the crossover. Traditionally, a crossover would happen when a story would start in one superhero’s comic magazine and then end when the character would “cross over” into the magazine of another hero where they would team up against the threat and bring the story to its conclusion. The difference between superheroes and fairy tale characters is that superheroes exist within serialized continuing narratives while fairy tale characters are flat characters defined by their actions in a specific story. So, there is the need to cross over not just the characters but the entire narratives as well.